Abstract
The copy and paste command in ObserVIEW allows the user to move data between graphs and software applications to perform data comparison. This action can be useful for comparing graph data from different time locations, multiple test results, various test environments, and more.
Question
How can I apply the copy-paste feature in ObserVIEW?
Answer
The user can copy graph traces, annotations, or the graph in its entirety with the Ctrl + C command or right-click > Copy. Home > Copy Graph copies the selected graph. The copied data is saved to the Window’s clipboard.
Copy the graph statistics as text in the Statistics pane to the right using the “Copy all values” button. Similarly, copy graph properties by right-clicking and selecting “Copy All Values.”
There are several options as to where the data can be pasted.
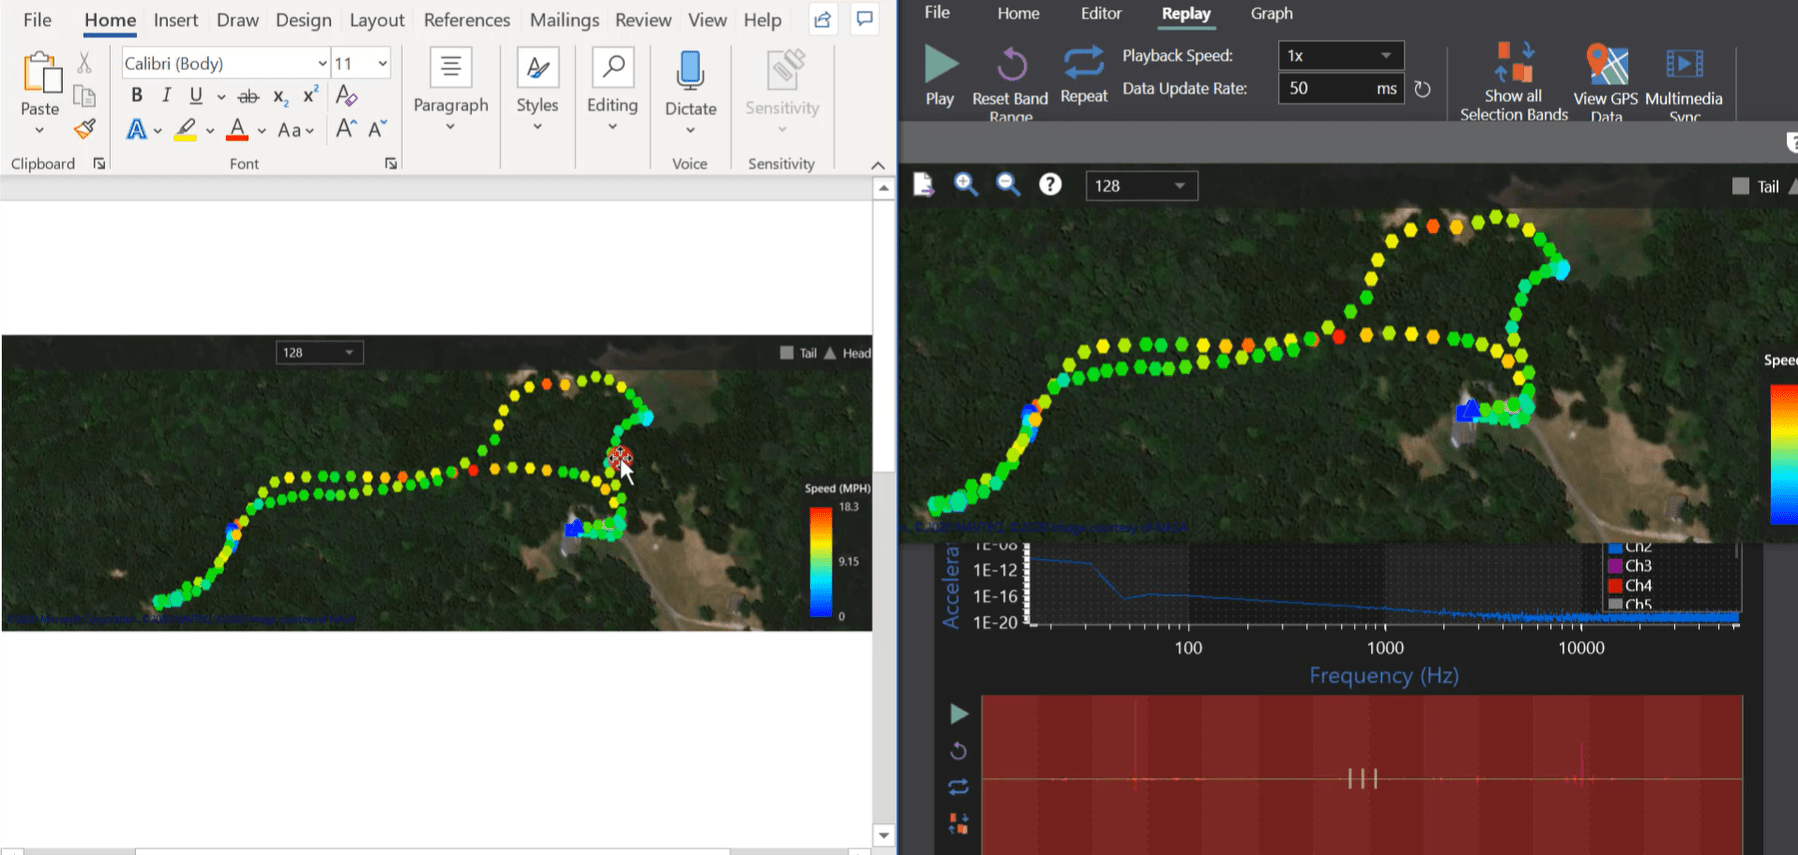
Copy and paste feature from ObserVIEW to Microsoft Word.
Copy and Paste Within ObserVIEW
Within the ObserVIEW software, graph traces can be copied and pasted to any graph to create a static trace, including the same graph from which it was copied.
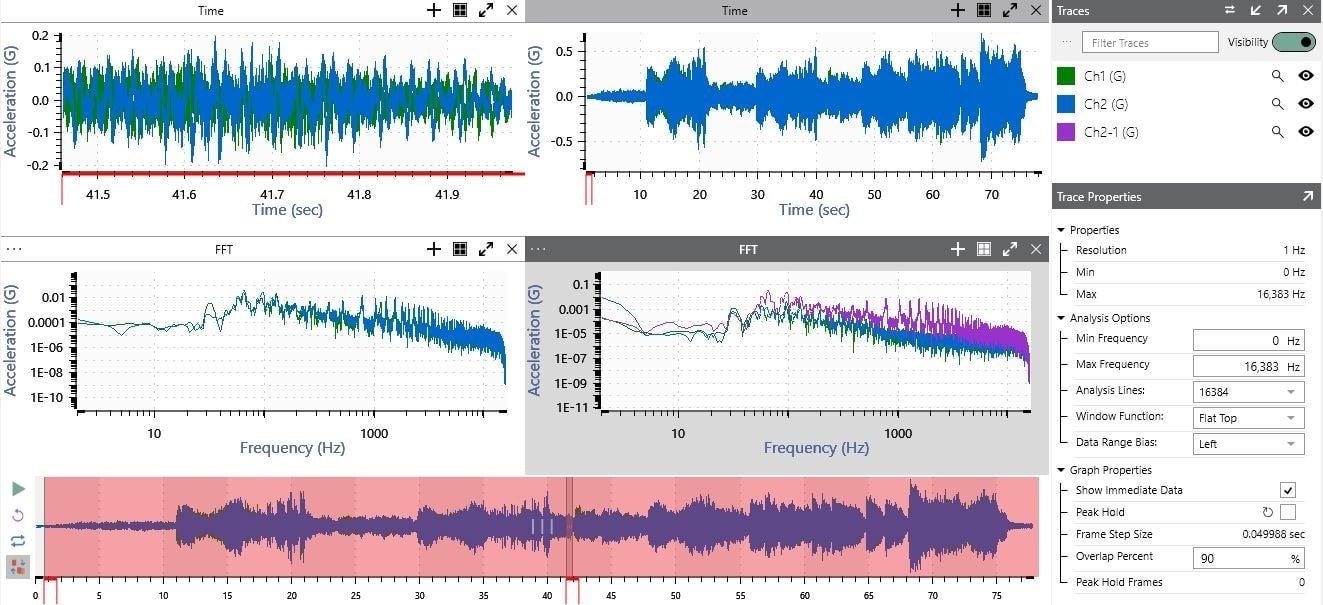
In the two analysis groups below, the Ch2 trace from the left FFT was copied and pasted to the right FFT (Ch2-1). As the user scrubs through the data, the Ch2-1 trace (purple) is static, which allows the user to compare the FFTs from different time locations.
This option can also be used to compare a PSD, cross-spectral density, etc. for a whole file to any portion of the file. For example, the user can copy a PSD from one recording and paste it to another. From there, they can compare different events from multiple recordings, multiple locations in the same recording, or both.
NOTE: PSDs should use the same parameters when performing comparisons.
The copy and paste command also includes complex traces like the transfer function.
Between Software Programs
VibrationVIEW
Following a shaker test in the lab, engineers can export VibrationVIEW test data to an analysis software like ObserVIEW for further review.
To compare data from a VibrationVIEW graph to data in ObserVIEW, you can use the copy and paste command. Simply copy the trace in VibrationVIEW and paste it into the desired graph in ObserVIEW. The frequency range, sample rate, lines of resolution, and other parameters do not have to perfectly align with the data in ObserVIEW; the software will adjust to accommodate the new data. If the units in VibrationVIEW differ from those in ObserVIEW, the program will add a second axis with the new units.
Conversely, data from ObserVIEW can be copied and pasted into VibrationVIEW.
Reporting
VibrationVIEW includes a built-in report feature, Report Builder, where engineers can view, edit, and export a template or custom report. You can add ObserVIEW data to the exported text or Microsoft Word® file.
CSV or TXT File
A graph or trace from ObserVIEW can be copied and pasted into Microsoft Excel® or a text editor. When pasting data into another application, the user can access textual, tab-delimited data or an image of the graph. Pasting into a spreadsheet application retrieves textual data from the graph while pasting into a word-processing application defaults to an image (but may allow the text option). Copying and pasting a graph as an image in Microsoft Word can be beneficial for reports.
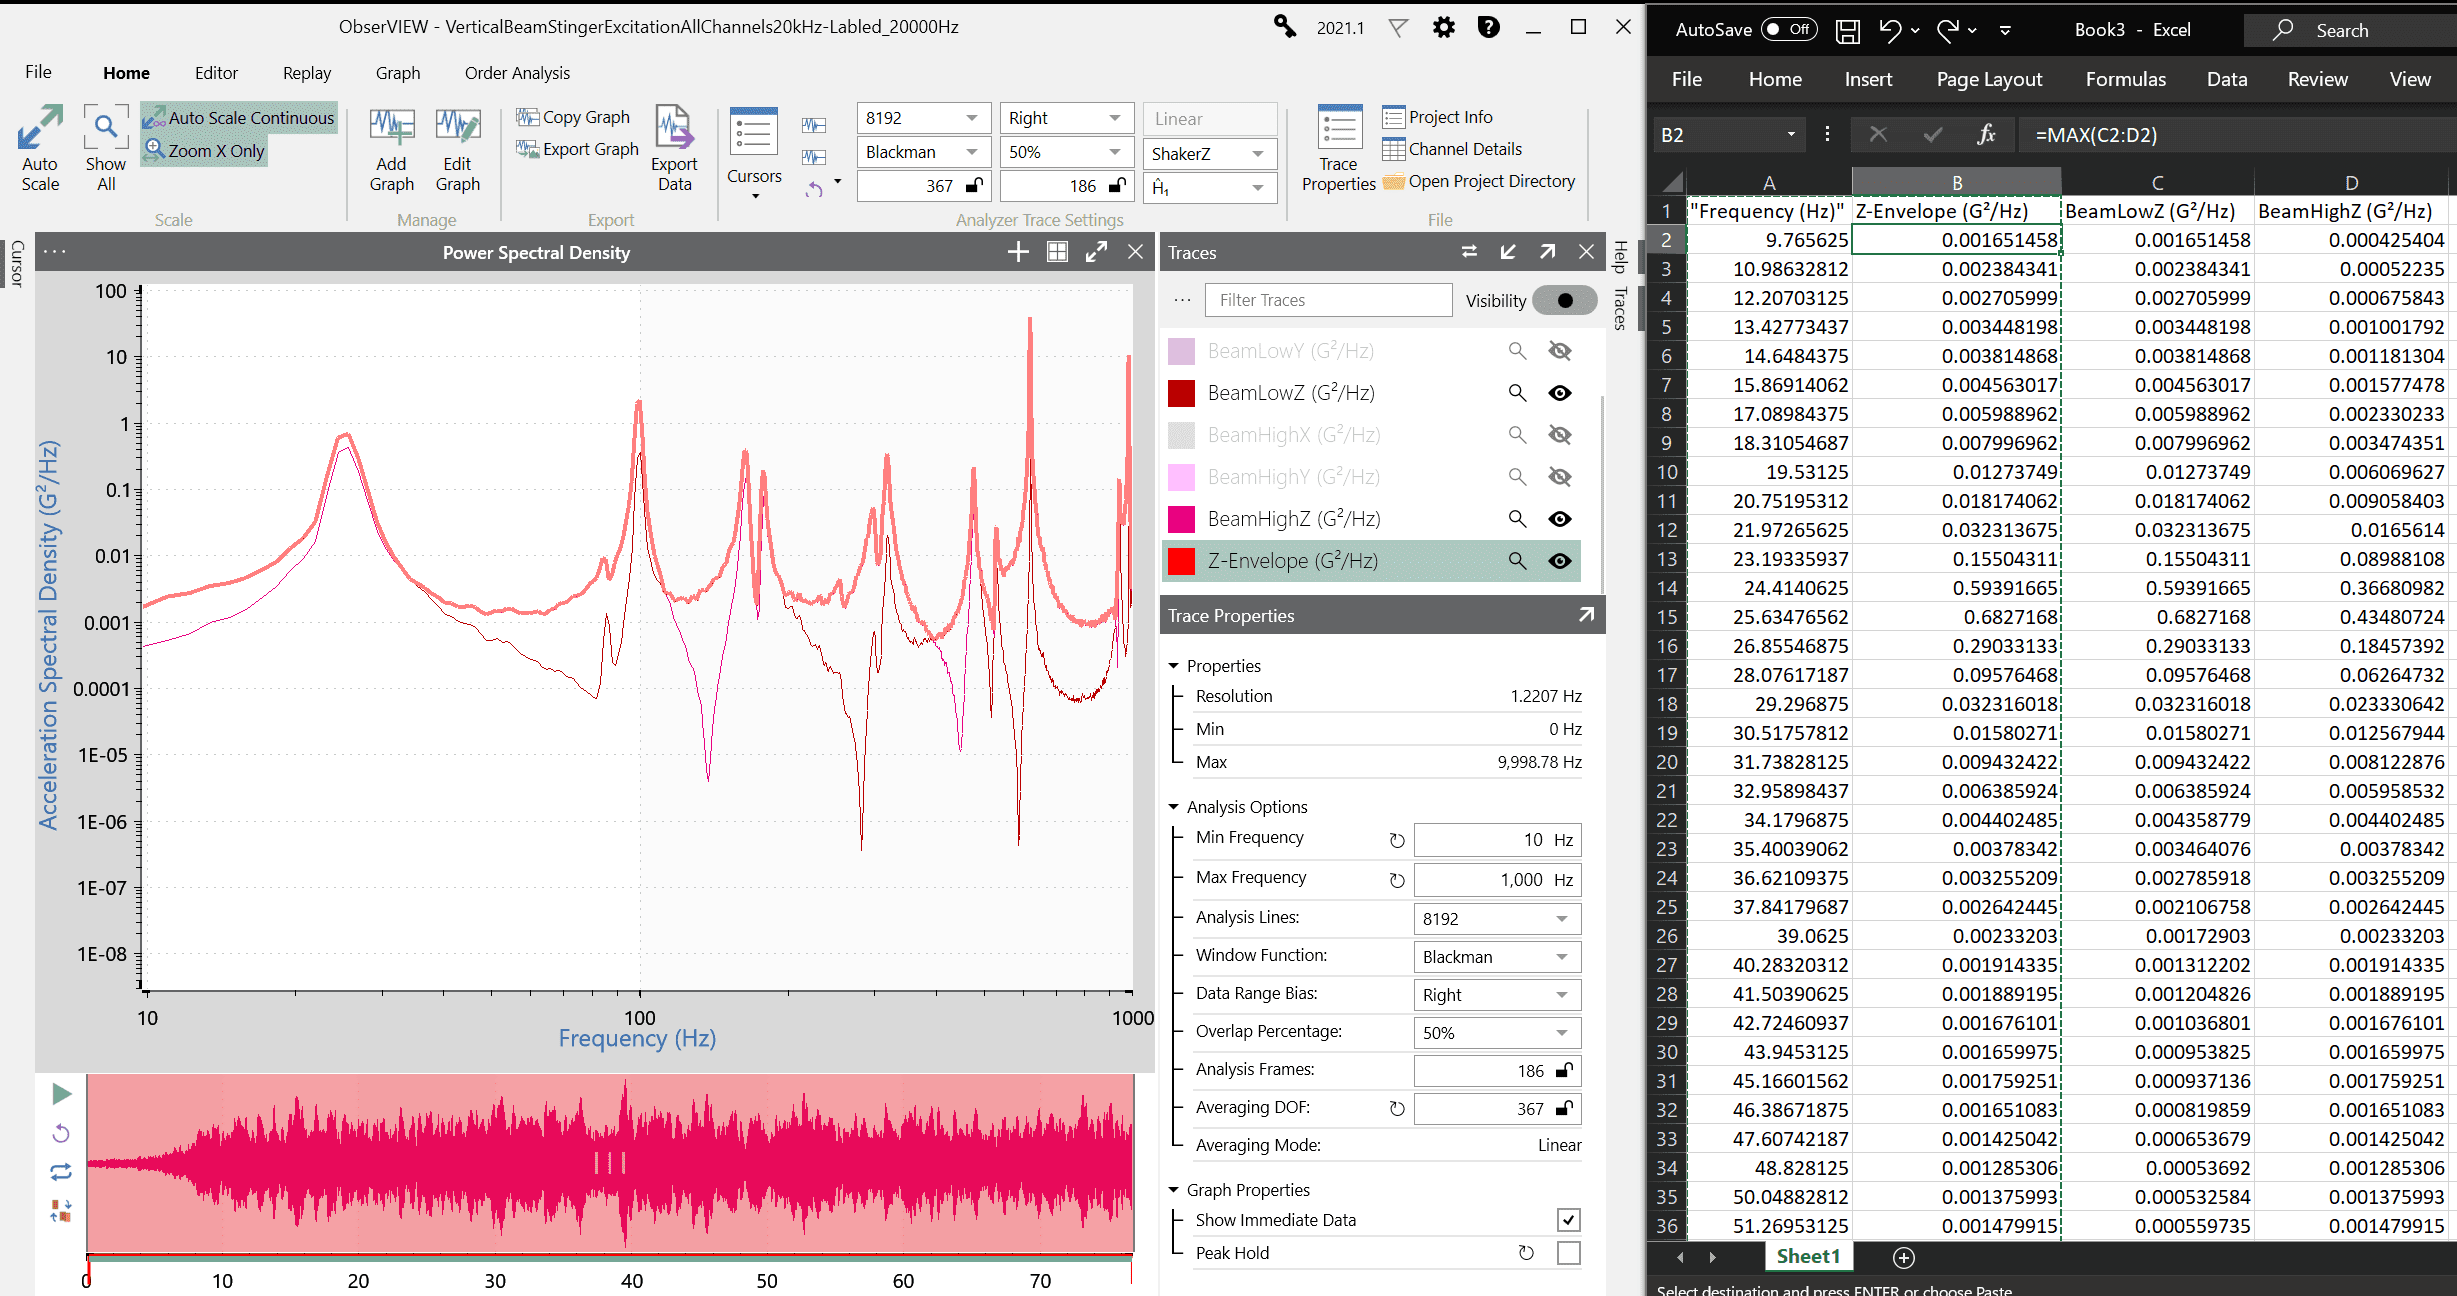
Copy and paste feature from ObserVIEW to Excel.
Text data will often contain summarized data for each trace that is formatted with a maximum and minimum column to save time and space. When the user zooms in on the graph, the copied data is the actual data as it would appear in an exported CSV or TXT file.
Data from Excel or a text document can also be copied and pasted into a graph. For example, if there is a tolerance band the user must meet, they can copy the data from Excel and paste it to the graph and use it as a reference trace. The copy and paste option from Excel to ObserVIEW can be used to paste generic traces like visual references, tolerance lines, boundary conditions, and more.