Dynamic Signal Analysis
Vibration data acquisition hardware system
ObserVR1000
Dynamic Signal Analyzer
Recording & Analysis
Battery-powered, autonomous data acquisition in the field or lab
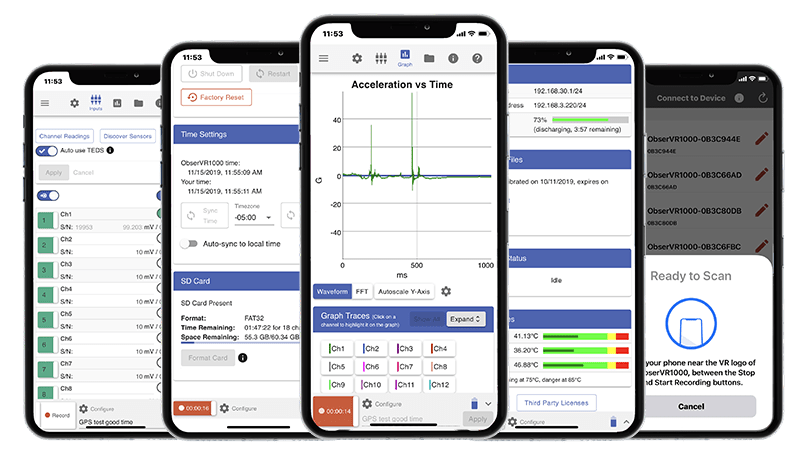
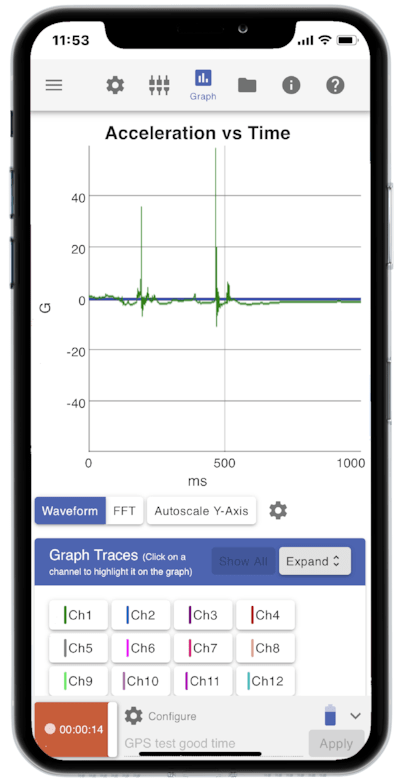
Touch the ObserVR1000 with NFC, and the VR Mobile app instantly creates a WiFi connection.
Select a trigger level, slope, channel, and duration to capture transient events.
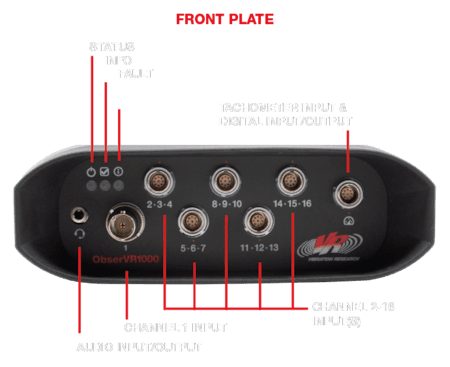
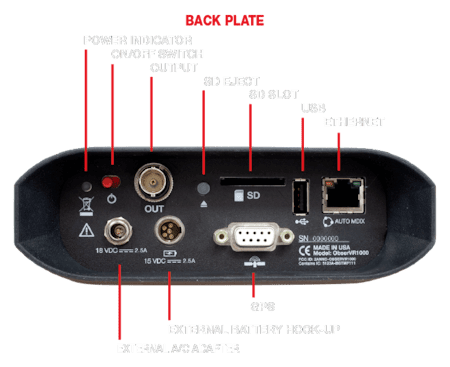
Easy set up of multi-channel recordings with audio, GPS, tachometer, and more.
Start/stop recording on startup or at defined levels, transient events, and more.
Mobile App
Smart setup, monitoring, and interaction with the ObserVR1000
Onboard Applications
VR Mobile & ObserVR1000
Field Data Recording
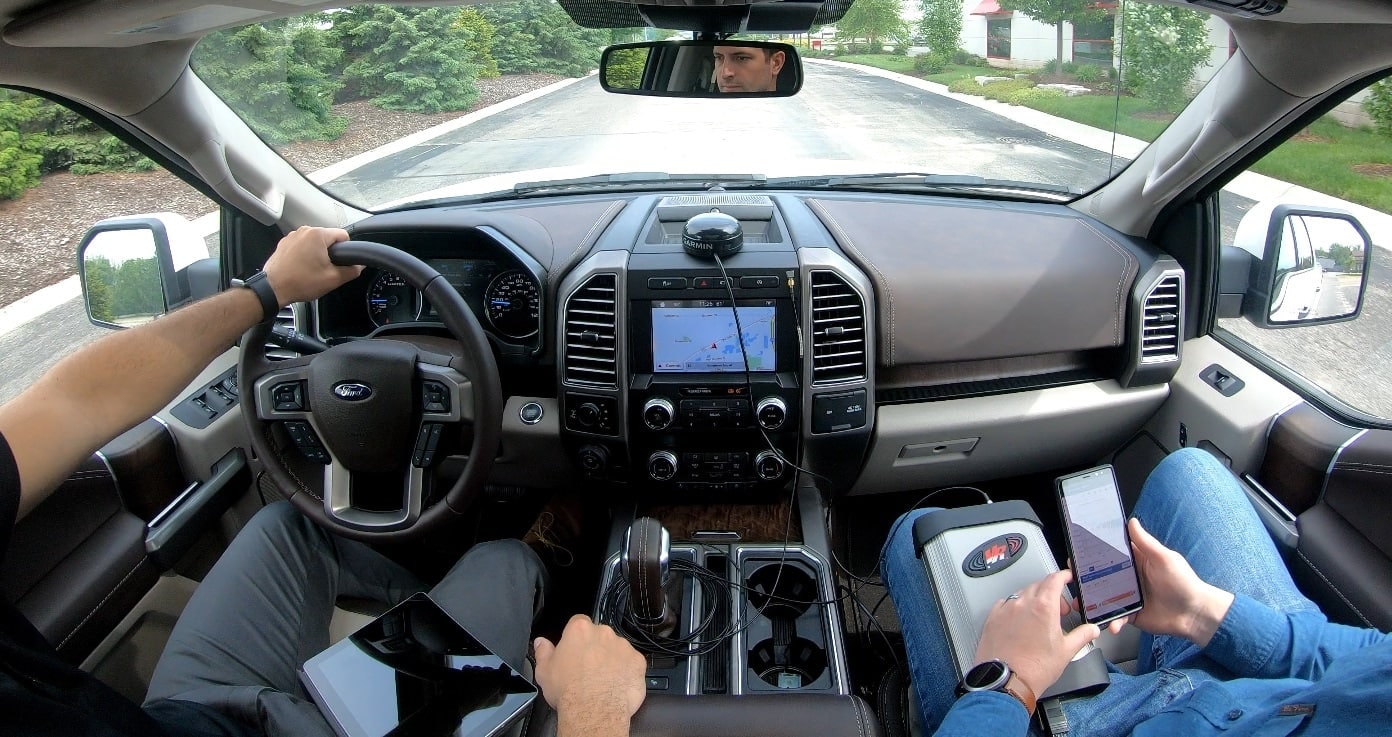
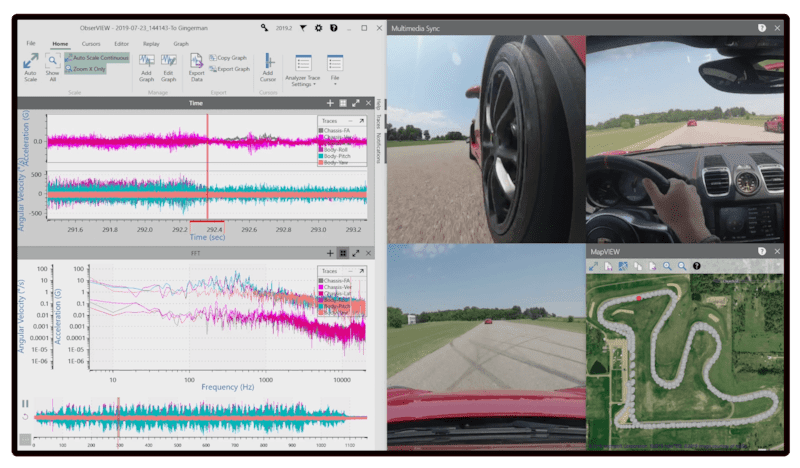
Record data in the field for validation, comparison, and test development. Monitor live data from any mobile device (and simultaneously in the lab).
Vibration Test Monitoring
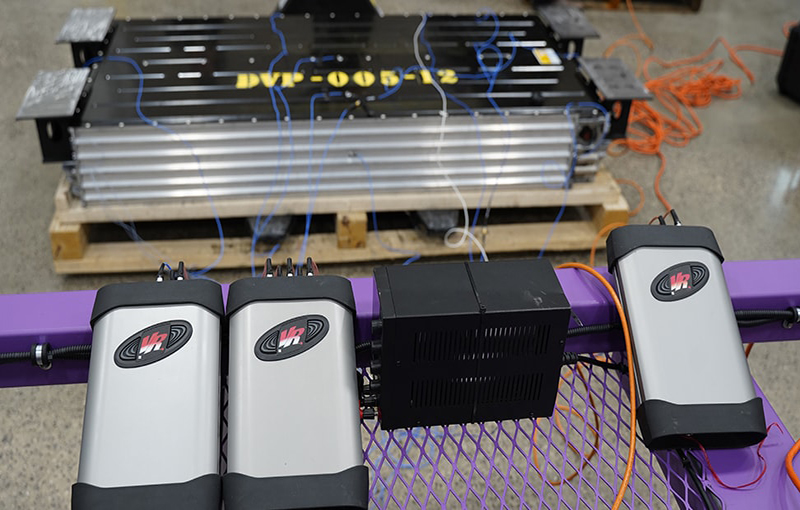
Monitor live test data to detect DUT failures in real time or independently verify results.
Real-time Analysis
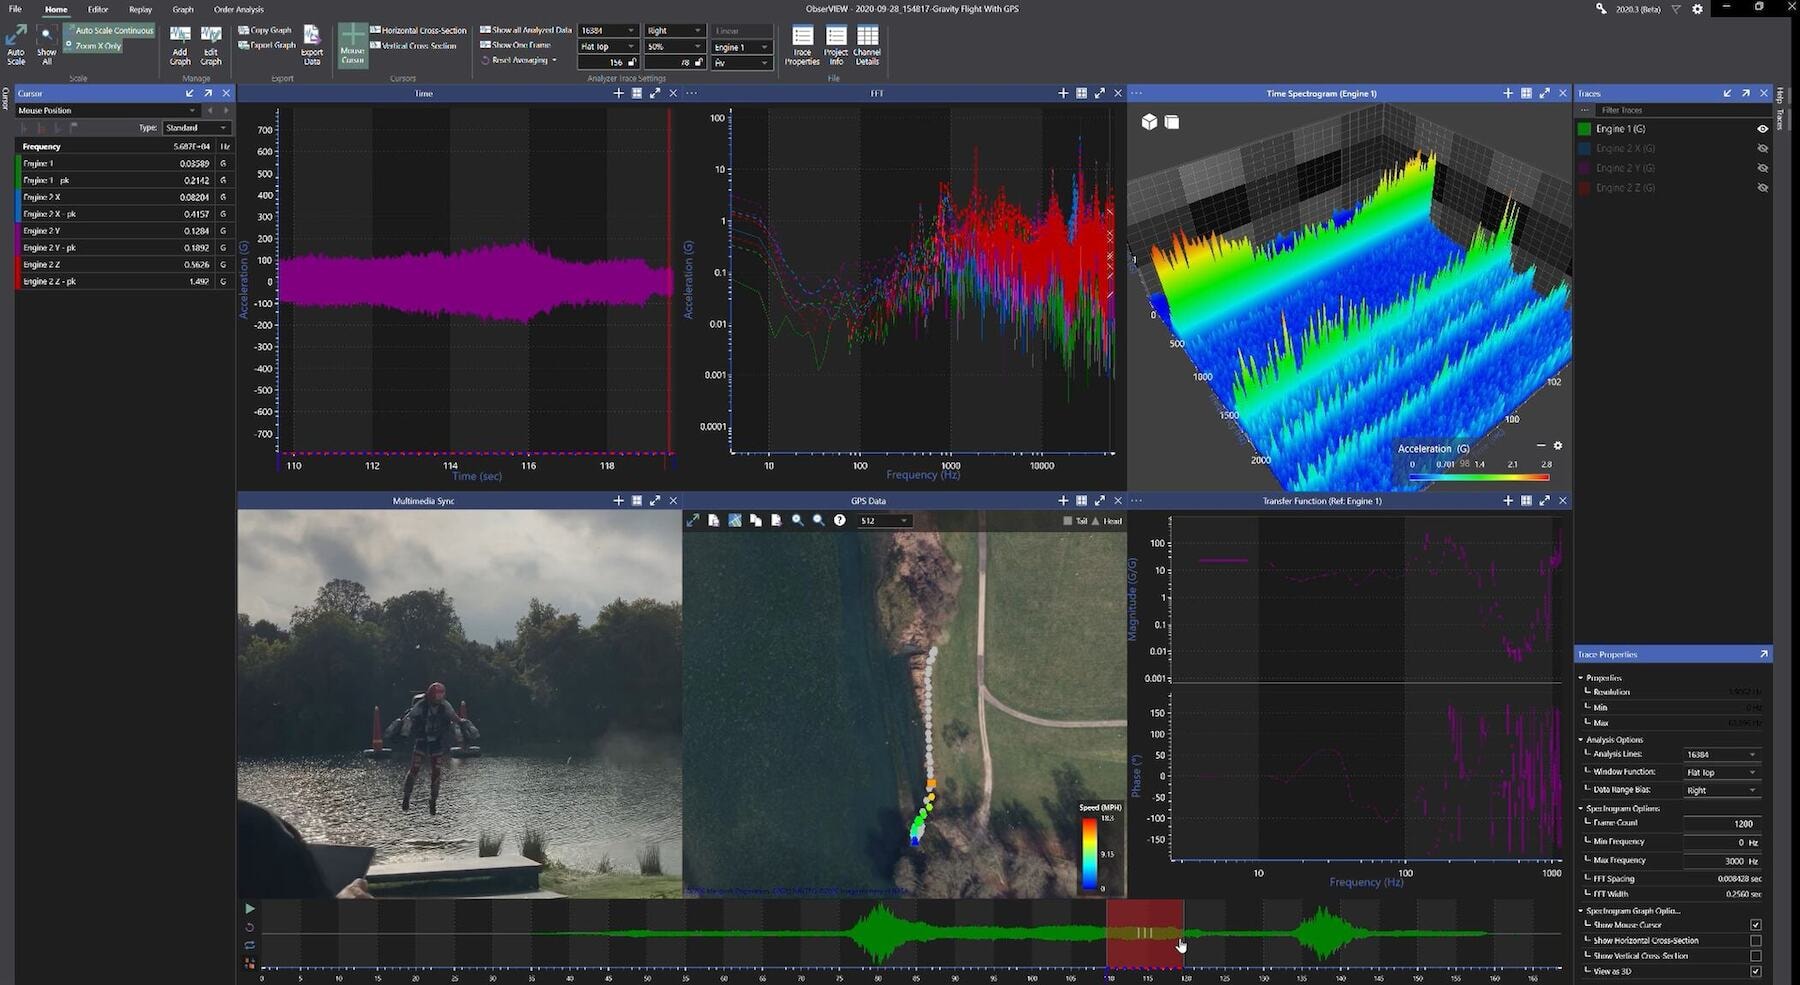
With Live Analyzer, you don’t have to wait until post-process to begin data analysis. View data in real-time and pause the live stream to select, analyze, and export data.
Post-process Reporting
Confirm test completion and consistency, identifying deviations between test and specification, and create summary reports.
Do More with Your Data
Analyze, Create, Run
Why Record Data?
Engineers in industries such as transportation, automotive, aerospace, and packaging use field data recordings throughout the product development cycle for proof-of-concept qualification, design evaluation, and process validation.
- Confirm environmental operating points and design destruct limits
- Act as initial reference to detect anomalies or degradation
- Improve digital twin simulation accuracy
- Enhance root-cause analysis and confidence in design direction
- Establish appropriate test limits and durations
- Generate statistical distributions for reliability and durability
- Generate tests that reflect the operational environment

ObserVR1000
Hardware Versatility
The versatility of the ObserVR1000 dynamic signal analyzer suits many test setups. Connect it to WiFi and collect data in the field. With the VR Mobile application, you can even monitor the data stream from a distance.
In the lab, connect via Ethernet and watch the recording in real time with the Live Analyzer feature or monitor fatigue damage with the Live FDS software.
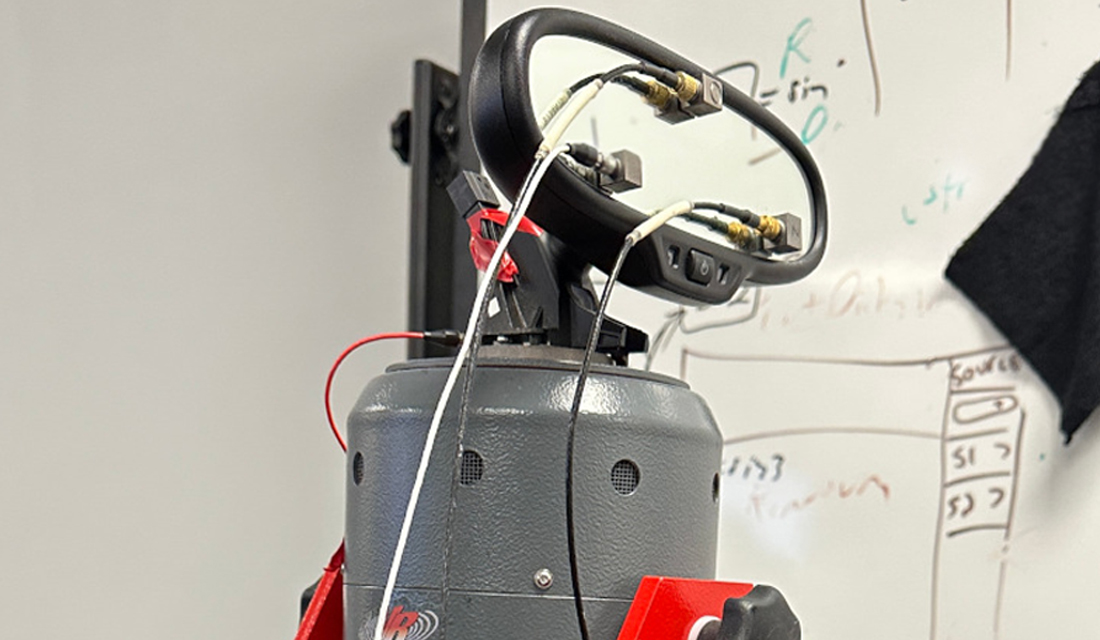
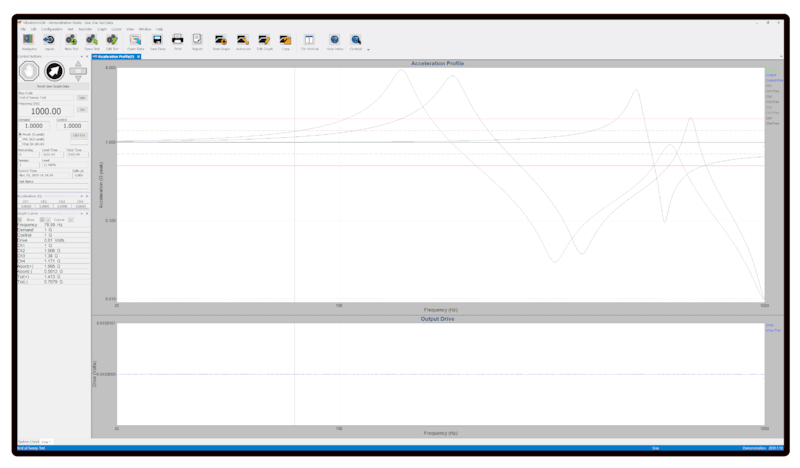
Do you also perform vibration testing? Conveniently use the ObserVR1000 to drive any electrodynamic or servo-hydraulic shaker. The ObserVR1000 is compatible with the VibrationVIEW software to control vibration test profiles.

