SAE J2380™ is a test standard issued by SAE International® for the vibration testing of electric vehicle batteries. Its test procedure qualifies the durability of an electric vehicle battery module/pack before production.
J2380 provides a vibration breakpoint and schedule for a random vibration test. However, the scope of the document includes the following caveat:
“Preferably, a specific vibration durability profile should be developed based on actual vehicle measurements for the specific electric vehicle application.”
A custom test profile will more closely replicate the electric vehicle’s end-use environment, which depends on the target customer and sales region, amongst other factors. A more accurate test profile improves confidence in the test results.
The standard’s provided test levels are meant to simulate “long-term, road-induced vibration and shock,” meaning a lifetime of use, and J2380 describes the process of determining its values. We can replicate the process described in J2380 to develop a specific vibration durability profile.
As an example, we will use recorded data from a Cadillac Lyriq to build an SAE J2380 random test profile.
Test Levels
The J2380 vibration profile is an accelerated test that simulates a battery’s lifetime of use. A custom test profile must factor in all the vehicle’s likely end-use environments and weigh them to develop a test with cumulative exposure.
Recording Data
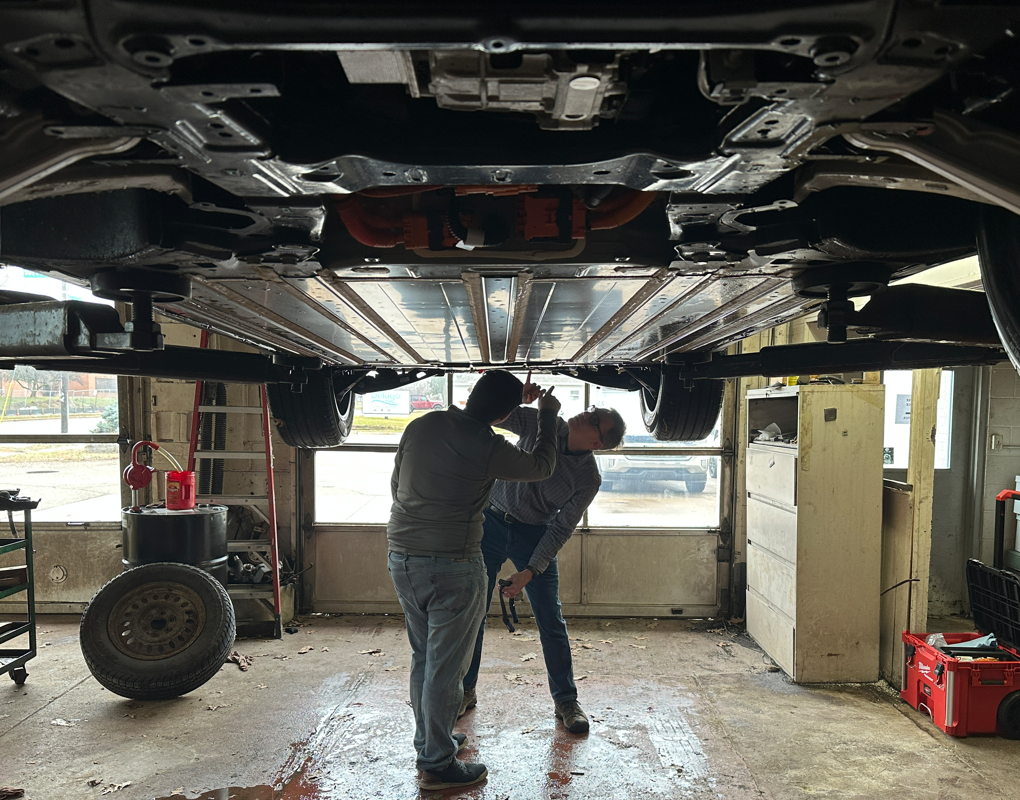
To achieve J2380’s defined tests, the standards committee used “rough-road measurements” recorded at likely mounting points for the battery. For the Lyriq, data were collected from:
- Front inverter
- Front drive unit mount
- Front lower mount
- Front chassis lower
- Front battery
- Rear drive unit
- Driver, bottom, and passenger
- Rear drive unit mount
- Rear battery
The test procedure calls for a shaker test in the vertical, longitudinal, and lateral axes, either one axis at a time or on a triaxial shaker. Data were collected on the Lyriq in the three axes using triaxial accelerometers. The vibration at each axis may differ, so it is not sufficient to record data in one axis and use the resulting test profile for all three.
The Lyriq was driven on various conditions, such as gravel and highway. Engineers should consider all conditions the battery may experience, including extreme outliers.
Data Analysis
The recorded data from the Lyriq were imported in the ObserVIEW analysis software. First, data from two ObserVR1000 devices were combined. GoPro video was referenced to confirm the data files were synchronized. Then, the engineers performed integrity checks on the data. Finally, a high-pass filter with a 2 Hz corner frequency was applied.
Test Development
On average, an electric vehicle is driven over some road conditions more frequently than others. As such, data from each condition needs to be weighed appropriately in the test profile.
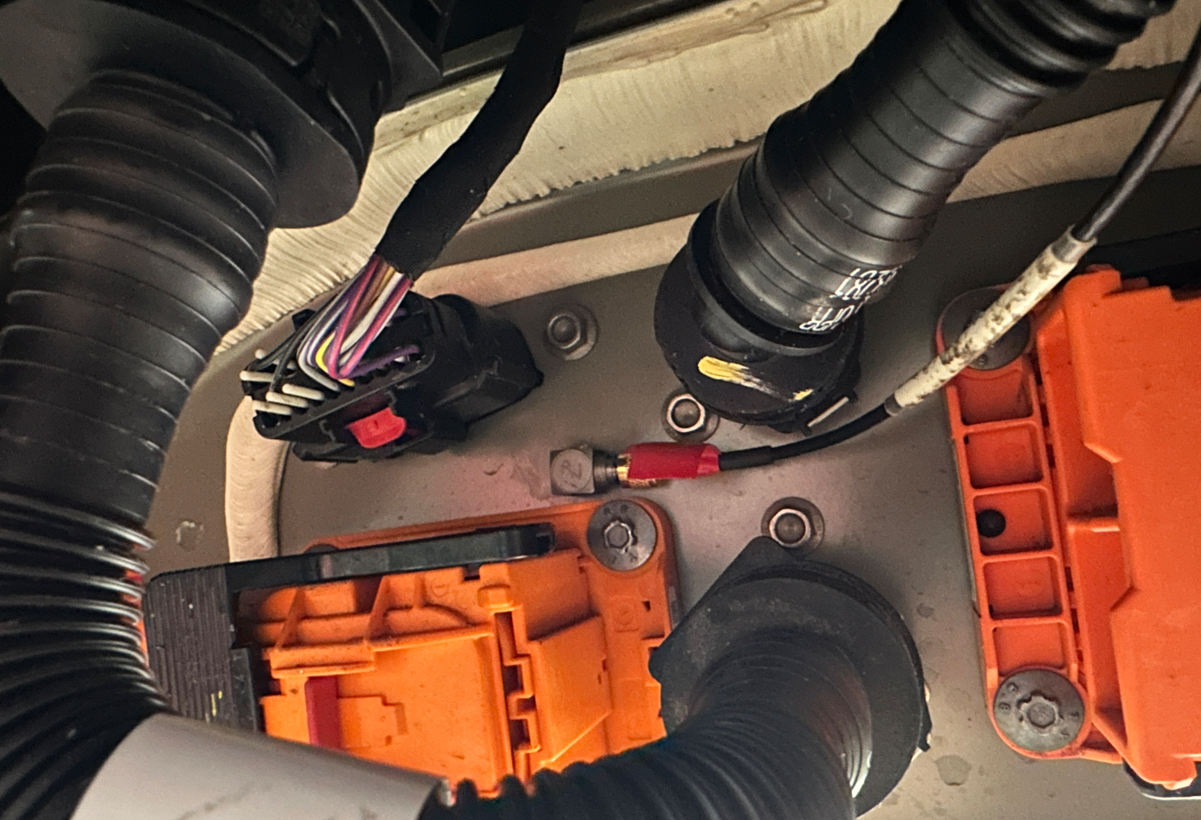
Sensor mounted on battery.
J2380 briefly explains its enveloping technique, where weighted values were combined to develop a cumulative test profile. The standards committee approximated an envelope of cumulative exposure, where the envelope corresponded to approximately 100,000 miles of use at the 90th percentile, meaning that 90% of vehicles will experience fatigue no greater than the test profile in 100,000 miles.
To develop a similar test in ObserVIEW, the combined data were imported into the software and processed with the Fatigue Damage Spectrum (FDS). The data measured at the rear battery location in the lateral (LA) axis was used to develop a test profile.
FDS-correlated Random Test
 Using the Random Test Generation option, vibration groups were created for the rear battery pack. These groups allow engineers to organize data into different environments with different acceleration factors, if desired. In this case, three groups were created for city, gravel, and higway environments.
Under the trace properties, the FDS values for m and Q were defined.
- m: 4
- Q: 10
- 8 Hz to 2,000 Hz at 1/12 octave spacing
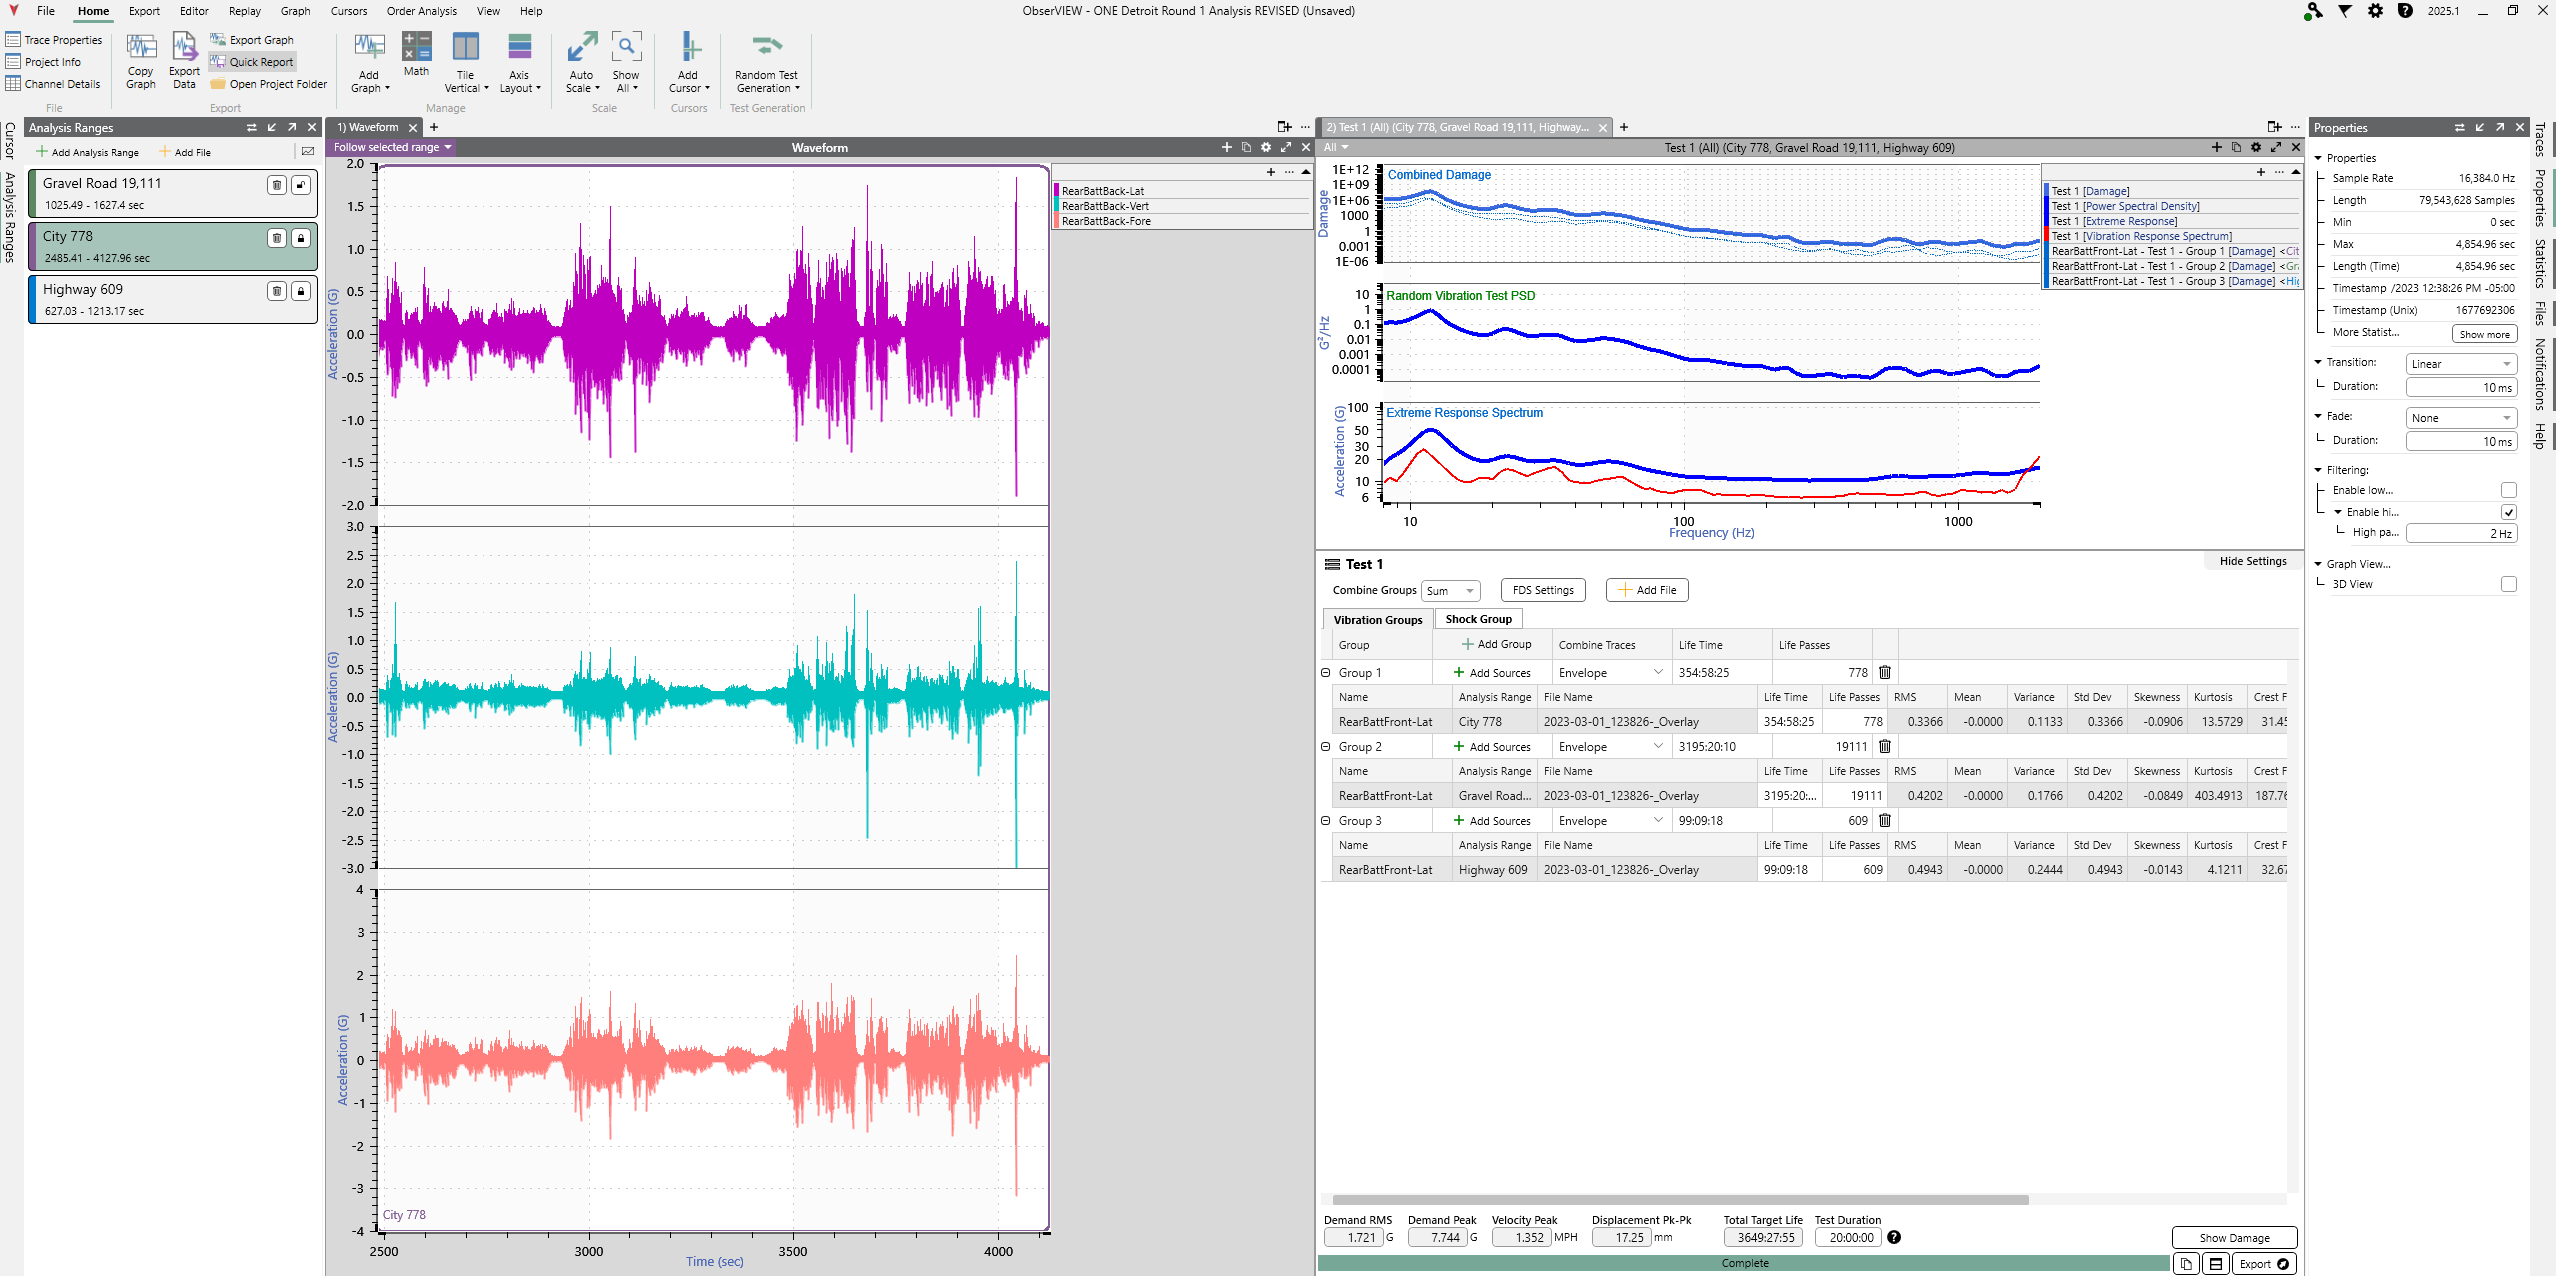
The engineers wanted the envelope to correspond to approximately 200,000 miles, which was chosen as a worst-case scenario. Life passes (or repetitions) were defined for each group based on typical use, weighing the impact that the fatigue of each environment had on the test profile. ObserVIEW’s Random Test Generation can assign different target life values to each group to weigh the effect of each on the lifetime of the product.
Note: Although the recorded data file had multiple channels, this example used one lateral measurement for each group. The technical note, Create an FDS-Correlated Random Test, discusses the option of importing multiple files.
The test duration was set to 20:00:00 hours, and Kurtosion® Time Compression was selected to reduce testing time without increasing energy. Test acceleration depends on the shaker table and appropriate acceleration levels. In ObserVIEW, engineers can compare the test profile to its extreme response spectrum (ERS)/shock response spectrum (SRS) to confirm an appropriate test acceleration is applied.
The software calculated an FDS-correlated PSD from the recorded data and test settings.