Abstract
The VibrationVIEW software can adjust the lines of resolution for random vibration testing to a maximum of 104,000 (26,000 with the VR9500). This abstract illustrates how to adjust the lines of resolution within the software and explains the benefits of this action.
QUESTION
A customer needed help eliminating low-frequency energy outside of their test parameters, which was close to the displacement limits of their shaker.
ANSWER
In the Random software, select the New Test button and select Random (Figure 1).
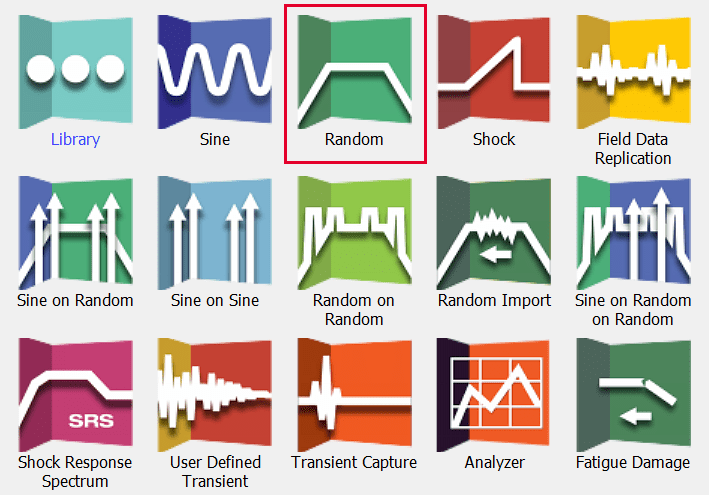
Figure 1. New Test dialog in VibrationVIEW.
Navigate to the Table tab, input your test profile, and select OK (Figure 2).
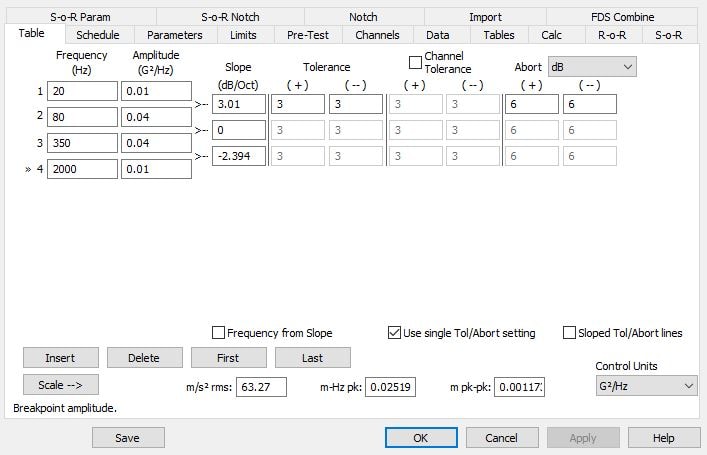
Figure 2. Table tab in the Random Test Settings dialog.
Select the Edit Graph button. Deselect the “Show active lines only” option (Figure 3).
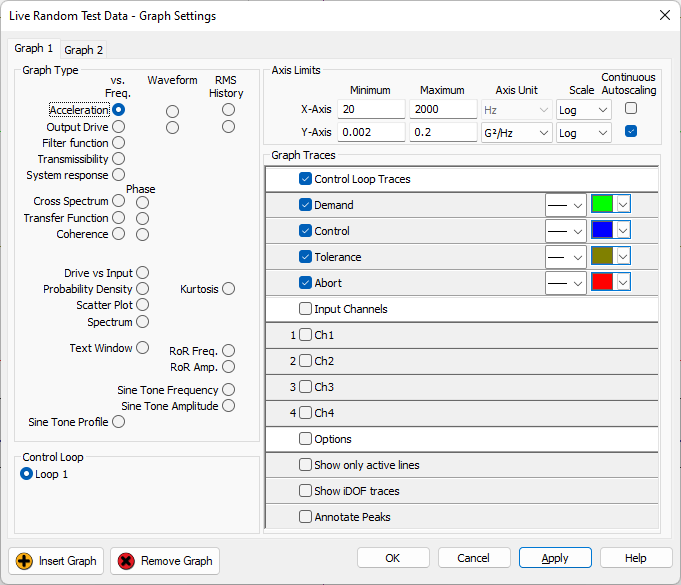
Figure 3. “Show only active lines” option in the Random Graph Settings dialog.
Select the Autoscale button to see outside of the control range. In Figure 4, the low-frequency roll-off is almost immediate. By default, VibrationVIEW has a set lines of resolution. In this example, the default lines of resolution value was 8,000.
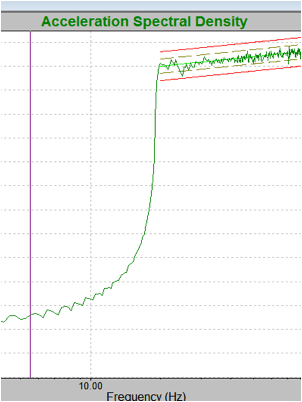
Figure 4. An auto-scaled view of an acceleration spectral density displaying frequencies outside of the control range.
To change the lines of resolution, select Edit Test and navigate to the Parameters tab. Deselect the “Auto” option for the “Lines” parameter (Figure 5). In this example, we adjusted the Lines value to 1,000.
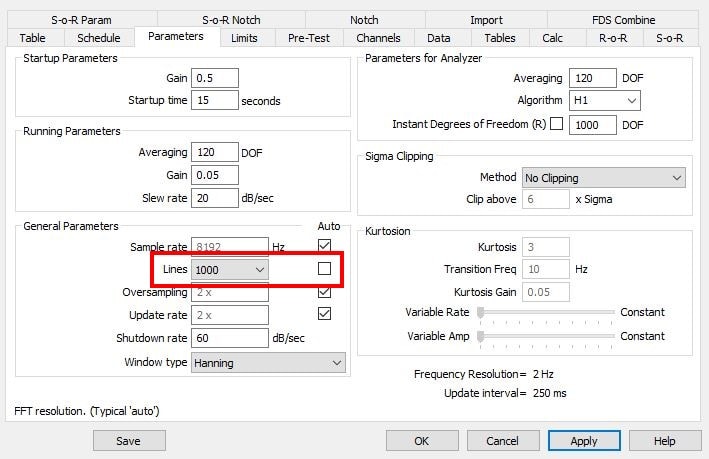
Figure 5. “Lines” parameter in the Parameters tab.
In Figure 6, the blue trace is a copy from the test with a lines of resolution value of 8,000. The green trace (1,000 lines) does not have as tight of a roll-off as the blue one. This additional energy in low frequencies will add more displacement to the shaker.

Figure 6. A comparison of traces with a lines of resolution value of 8,000 (blue) versus 1,000 (green).
Advantages of Higher Lines
A higher lines of resolution value gives a better frequency resolution for control, especially when attempting to control resonances. The accepted standard is at least 3 lines of resolution at the half-bandwidth of a resonance. This value results in a more accurate and realistic test.
For example, with a 10kHz sample rate at 800 lines of resolution, the frequency bins are 4.88Hz wide. At 26,000 lines of resolution, the frequency bins are 0.152Hz wide. Increasing the lines of resolution significantly increases accuracy.