Abstract
The Fatigue Damage Spectrum (FDS) software from Vibration Research is user-friendly, but engineers must follow a sequence of steps to properly utilize the software. The goal is to start with a single or multiple time-history file(s) that represent the vibration a product will experience throughout its life, then create a random PSD that is the damage equivalent to the product’s lifetime based on the imported files.
QUESTION
How do I create a test using the FDS software?
ANSWER
- Create a new FDS Test in VibrationVIEW
- Select New Test > Fatigue Damage

VibrationVIEW Fatigue Damage logo.
- Under the Import tab, enter the appropriate m and Q values for the product.
- As the m and Q Values for FDS technical note discusses, there are general values for m and Q (m = 8, Q=10). However, these values affect FDS test generation and test compression, so engineers may desire more specific values. The resource also provides instructions for developing more precise m and Q values for a product.
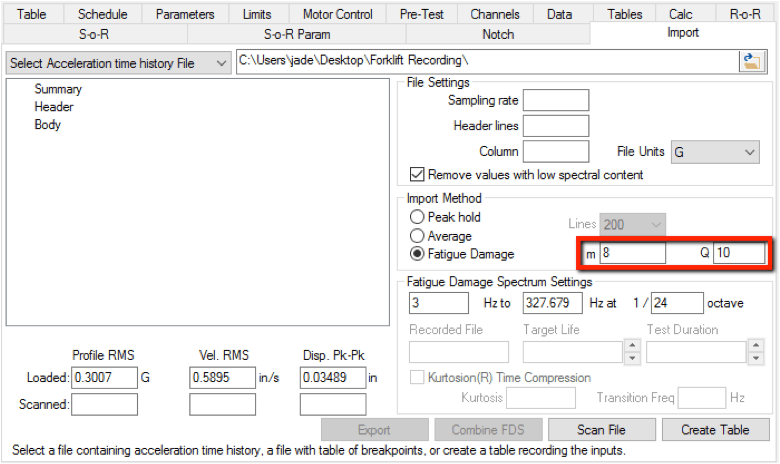
m and Q value fields under the Import tab.
- The frequency range the program uses to calculate the FDS can be customized under “Fatigue Damage Spectrum Settings.” Reducing these frequencies to the bins of interest or increasing the octave spacing will save calculation time.
- Under the Import tab, import the time history file(s)
- The time-history files represent the vibrations a product experiences in a lifetime. The files do not have to be a 1:1 replication of a lifetime of damage, but they should be as accurate as possible. The FDS software analyzes the time-history data using a single-degree-of-freedom oscillator, automatically adjusting for each frequency. For each degree of freedom, it uses rain flow counting to determine the cumulative amount of damage for each frequency bin.
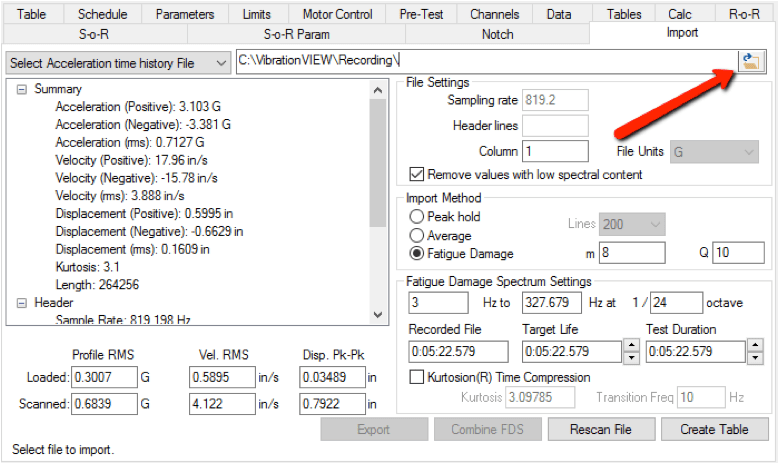
Import tab in the VibrationVIEW software.
- Under the Import tab, enter the Target Life
- For a single time-history file, the target life is the amount of time or number of cycles the program should run the time-history file to represent one lifetime of damage. This target could also be the length of a product warranty or how long the product should survive when exposed to the time-history file.
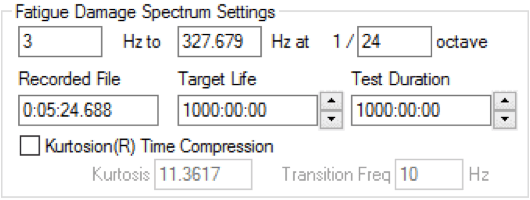
Fatigue Damage Spectrum Settings under the Import tab.
-
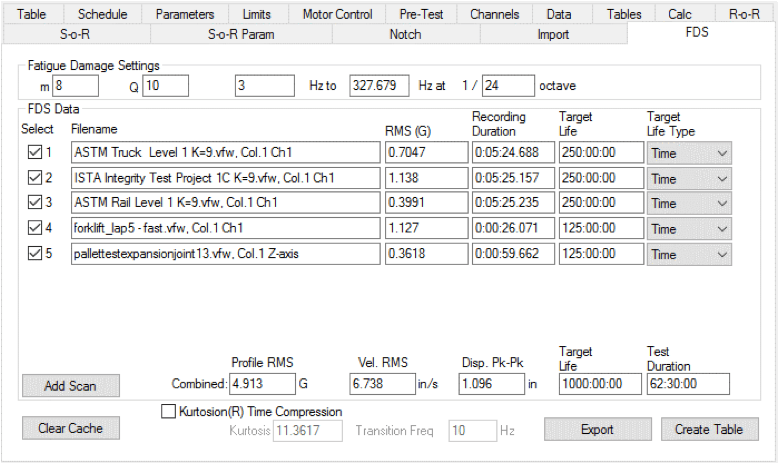
- For multiple time-history files, the sum of the target life for each file is equal to the total target life of the product. Under the FDS tab, assigning different target life values to each waveform weighs the effect of each waveform on the lifetime of the product.
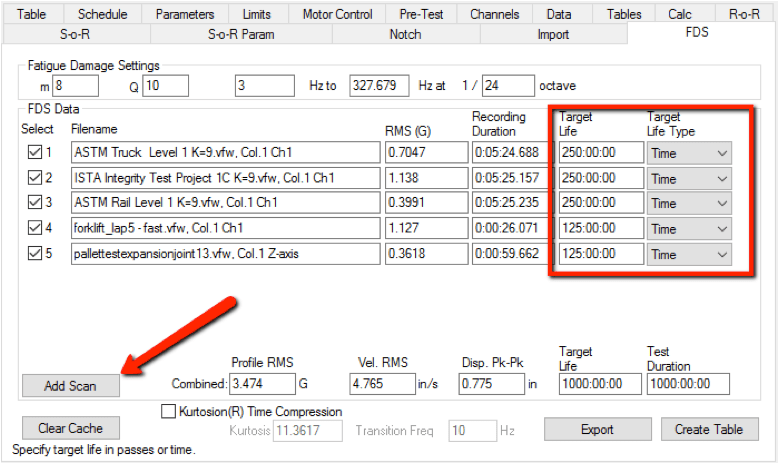
FDS tab in the VibrationVIEW software.
- Under the FDS tab, accelerate the test
- The software can accelerate the test profile, but an accelerated test is not the same as a test run for the full amount of time. The less the test is accelerated, the more accurately it represents real-world data. Additionally, the test acceleration is only as accurate as the m value for the product. The more the test is accelerated, the more important the m accuracy becomes. At a minimum, the instantaneous stress limit of the product cannot be exceeded.
- MIL-STD-810G recommends the acceleration factor should generally not exceed values of 1.414^(S1/S2) or 1.414^(m). Thus, for a product with m = 8, the maximum ratio between in-service time and test time can be 1.414^8 ≈ 16. If the target life of the product is 1,000 hours, it is recommended to run the test in no less than 62.5 hours.
FDS tab in the VibrationVIEW software.
- Under the FDS tab, add kurtosis
- Lowering the gRMS of the test is a primary reason for adding kurtosis. Another valid reason is to increase the kurtosis of the random PSD to reflect the peaks of the imported time-history files, especially when the kurtosis of the input waveform is high (k>3). Using Kurtosion®, it is possible to introduce kurtosis and vary the transition frequency to create peaks that represent the original files. The FDS software will automatically adjust for the added kurtosis to ensure that the generated profile is the damage equivalent of the input waveform(s). Notice the difference in the combined profile RMS before and after the addition of kurtosis.
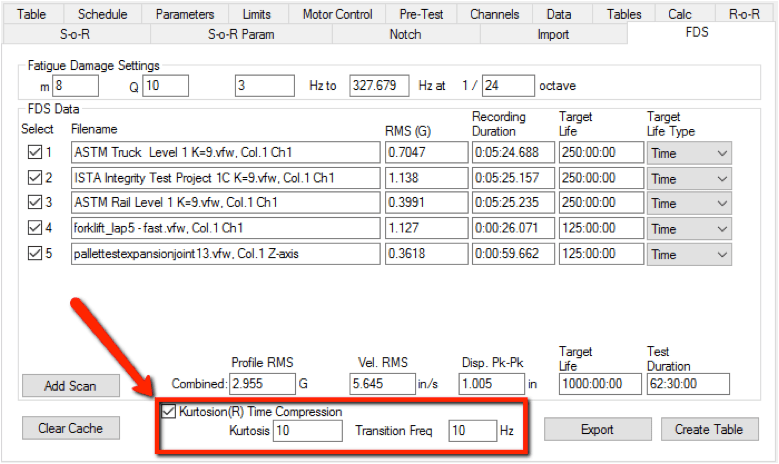
Kurtosion Time Compression fields under the FDS tab.
- Under the FDS tab, select the Create Table button
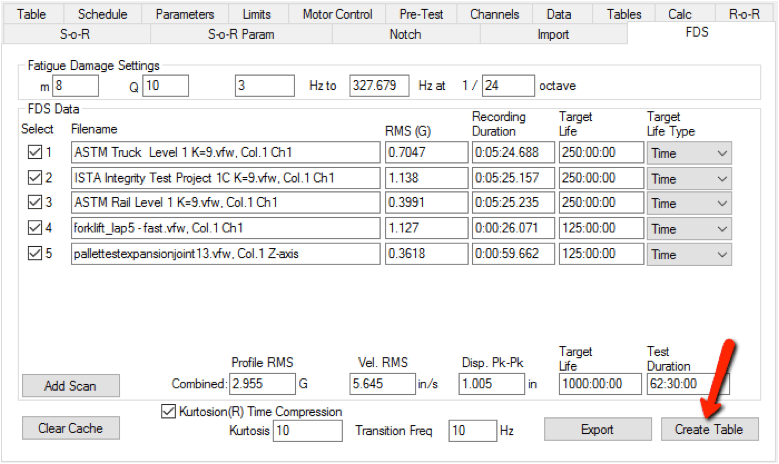
Create Table button under the FDS tab.
- Run the test
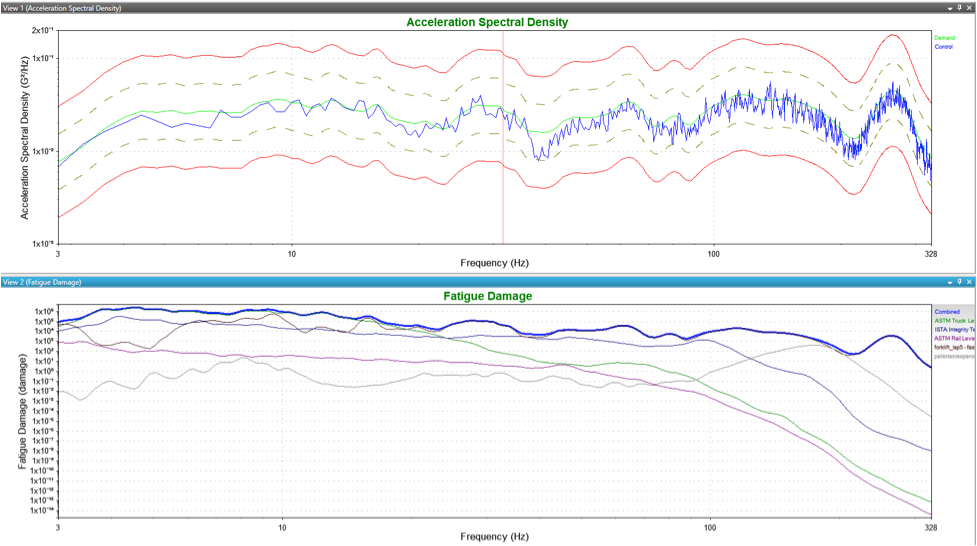
Resulting acceleration spectral density and fatigue damage graphs.
The Random PSD the software generates is the damage equivalent to the lifetime of the product based on the imported files, m and Q values, target life, test duration, and kurtosis. This information is valuable in every phase of testing, from initial product development to re-creating field failures in a lab environment.
For more information, please watch our webinar on the FDS software or contact an application engineer at vrsales@vibrationresearch.com.