Objects accumulate fatigue when subjected to continuous stress. To ensure safety and longevity, vibration test engineers must determine how long their product can withstand the operational environment before fatigue damage or failure. As products may experience hundreds to thousands of hours of use, they require a vibration testing method to assess a device under test (DUT) over many hours without expending significant time.
Random Vibration Test Acceleration
Several random vibration test development options are available for engineers who want to fatigue products quickly. Vibration test acceleration methods allow engineers to test a product for years of service in a fraction of the time.
What is a Random Vibration Test?
A random vibration test is a realistic method of bringing a product to failure, as real-world vibration is inherently random. A random test excites all frequencies in a defined spectrum at any given time. By simultaneously exciting all the product’s resonances, engineers can determine the interaction between multiple resonances.
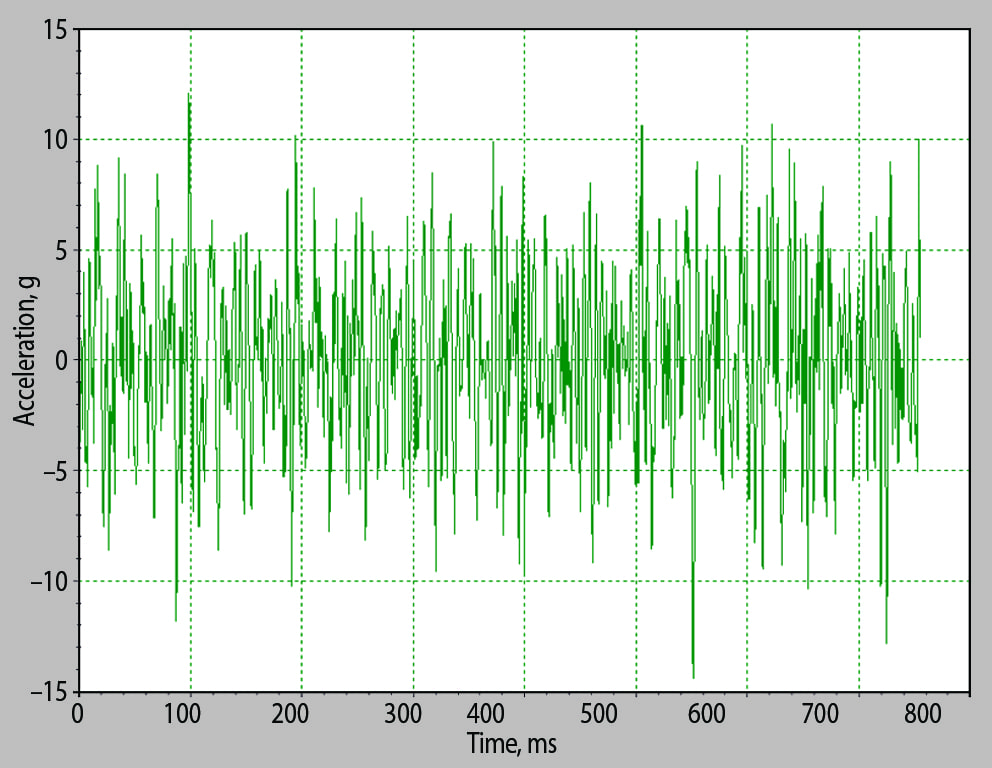
A random acceleration waveform.
Random Test Acceleration with FDS
The fatigue damage spectrum (FDS) is based on Miner’s rule of cumulative damage: fatigue damage accumulates until the product’s life dose of fatigue has been met, at which point the product experiences failure. With the FDS, vibration test engineers can accelerate their tests by increasing the system’s energy (RMS). To what level should they increase the RMS? The answer depends on the test duration the engineer wants to run (within reason).
Most likely, a product will experience a range of vibration environments in its lifetime. These vibration environments are often more complex than a simple sinusoid or Gaussian random waveform. The FDS can incorporate all the vibration environments a product will encounter throughout its lifetime.
Calculating the FDS
Test software calculates the FDS using a time-domain analysis that includes rain flow cycle counting. It uses time-domain analysis and defined material property (m) to calculate the relative damage and generate an FDS.
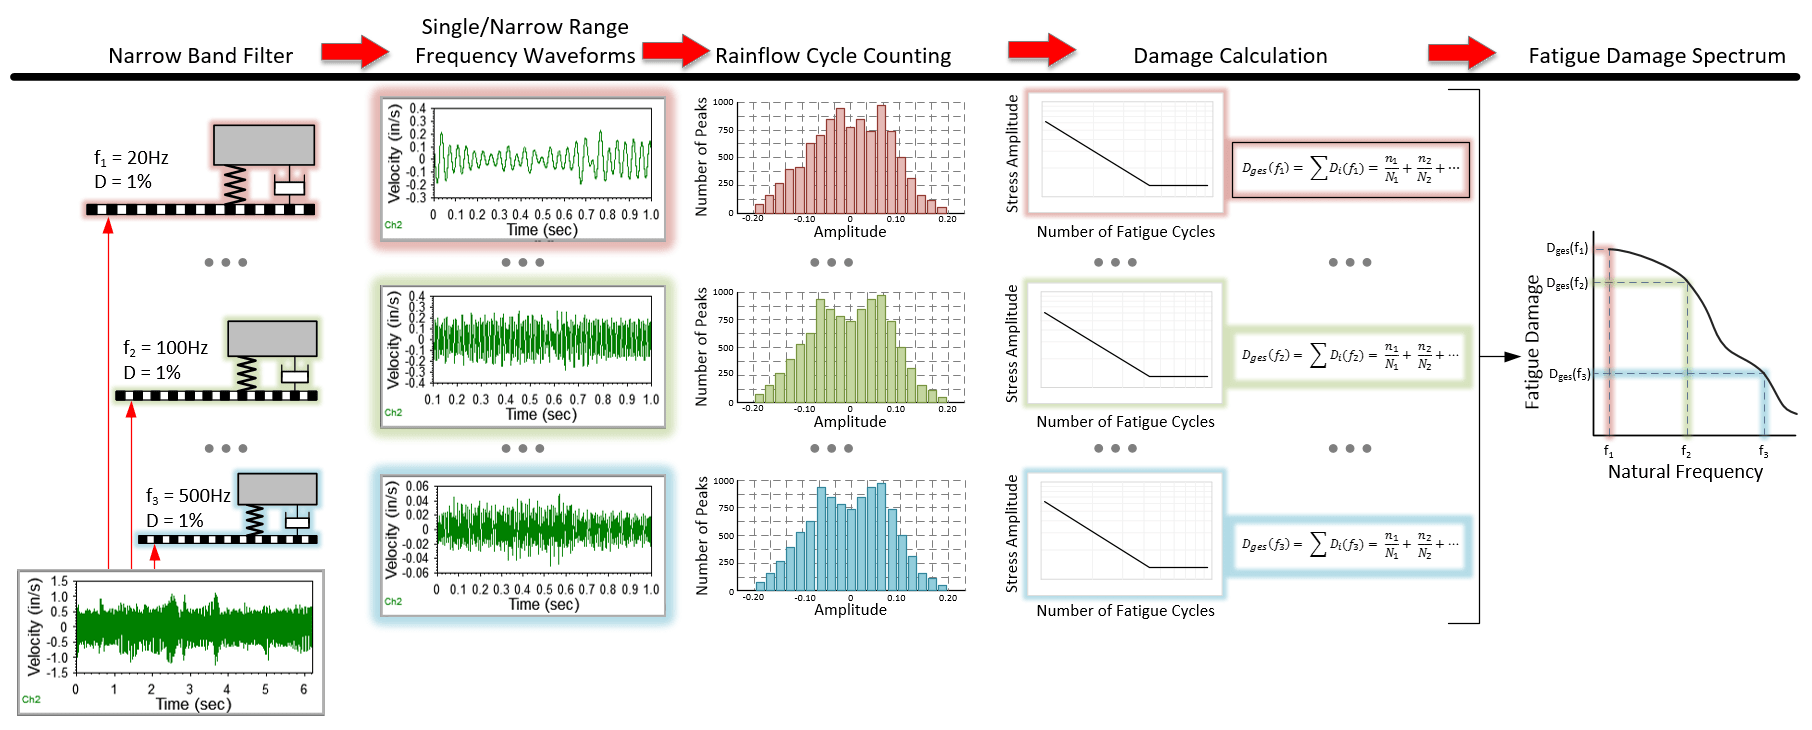
FDS calculation process.
Unlike the fast Fourier transform (FFT), the FDS is based on the response of single-degree-of-freedom (SDOF) systems. The FDS is a reliable method for generating a random test reflective of the real world, which is often non-Gaussian and non-stationary.
FDS Parameters to Consider
Quality Factor (Q)
The quality factor determines the damping value of an oscillation. A higher Q value will result in a lower rate of energy loss and, therefore, a slower end to the oscillation. Conversely, a lower Q value will result in a higher rate of energy loss and a faster end to the oscillation. The resonance quality factor is 0.5 divided by the critical damping ratio (ζ).
In FDS analysis, the quality factor is related to the Q of the filters to generate the single/narrowband time waveforms. This value should be greater than or equal to the sharpest resonance of the product within the test frequency range.
Slope of S-N Curve (m)
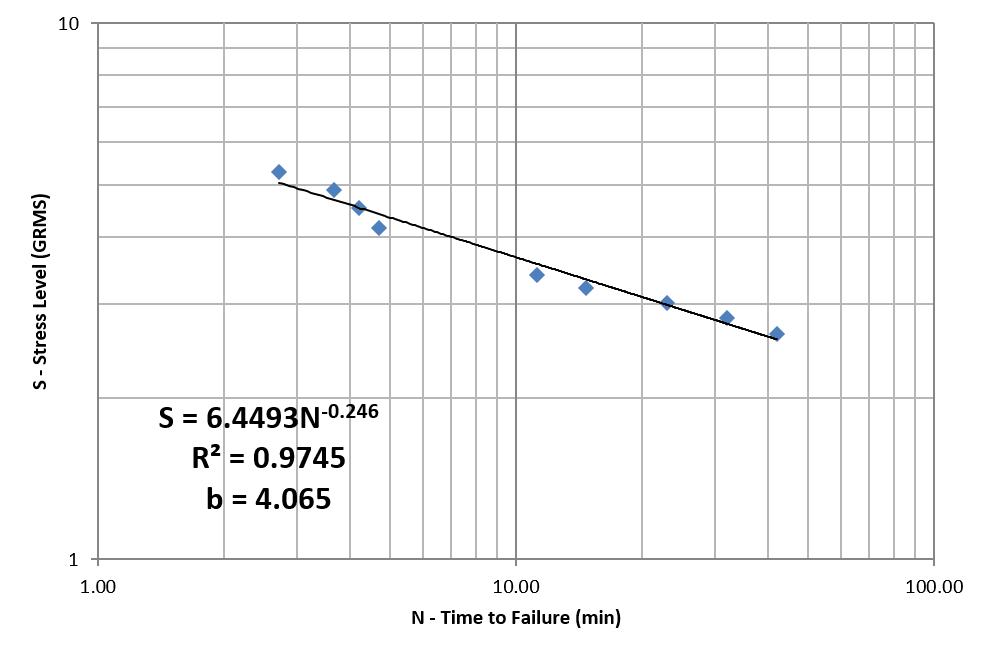 The S-N curve displays an inverse relationship between the maximum applied stress (S) and the number of cycles to failure (N) on a logarithmic scale. Cyclical stress above the yield stress can result in low cycle fatigue, and cyclical stress below the yield stress can result in high cycle fatigue.
The value of m is obtained from the S-N curve. MIL-STD-810H (2019) recommends using an m value of 7.5 for random vibration excitations, “but values between 5 and 8 are commonly used.” However, engineers can produce a value by testing several units with different vibration levels until failure and finding the m value most suitable for the data.
Kurtosis
Shakers running periodic random excitations can display non-Gaussian vibration responses at resonances. Kurtosis describes the distribution of a signal’s peaks from the mean. If the kurtosis of a random signal exceeds the Gaussian value of 3, the damage-inducing potential of the profile increases.
FDS import assumes a Gaussian data distribution because of the Henderson-Piersol method of computing fatigue. The PSD is based on the relative damage calculation computed at each frequency, so it will, by default, have a Gaussian distribution. Therefore, the FDS-generated PSD will not have the same peak distribution as the real-world environment.
Kurtosis control, such as Kurtosion®, can be added to modify the distribution of peaks to reflect the real-world environment while maintaining the damage based on the computed FDS, life duration, and desired test duration.
Kurtosion® accelerates random vibration tests by keeping the RMS value the same but redistributing the energy to add more high-energy peaks. While traditional testing methods average out resonant peaks, Kurtosion re-adds the damaging resonant peaks from the recorded data.
The engineer does not add new energy to the system by re-adding these resonant peaks. The PSD plot remains the same at all frequencies when they increase the test’s kurtosis level. Instead, Kurtosion changes the energy distribution, and the resonant peaks likely to fatigue the product faster occur more often. With Kurtosion, test engineers can bring products to failure quickly without increasing the total test energy.
Test Acceleration and Dominant Sinusoidal Components
 While the FDS is the standard tool for vibration test acceleration, there is an environment where the FDS falls short. If a product is subject to an environment with dominant sinusoidal components, the technician should use a sine-on-random (SoR) test—not a random test.
For sine-on-random test generation, the sine tones are accelerated separately from the random energy, which is accelerated with the FDS. Only after can the accelerated sine and random components be combined.
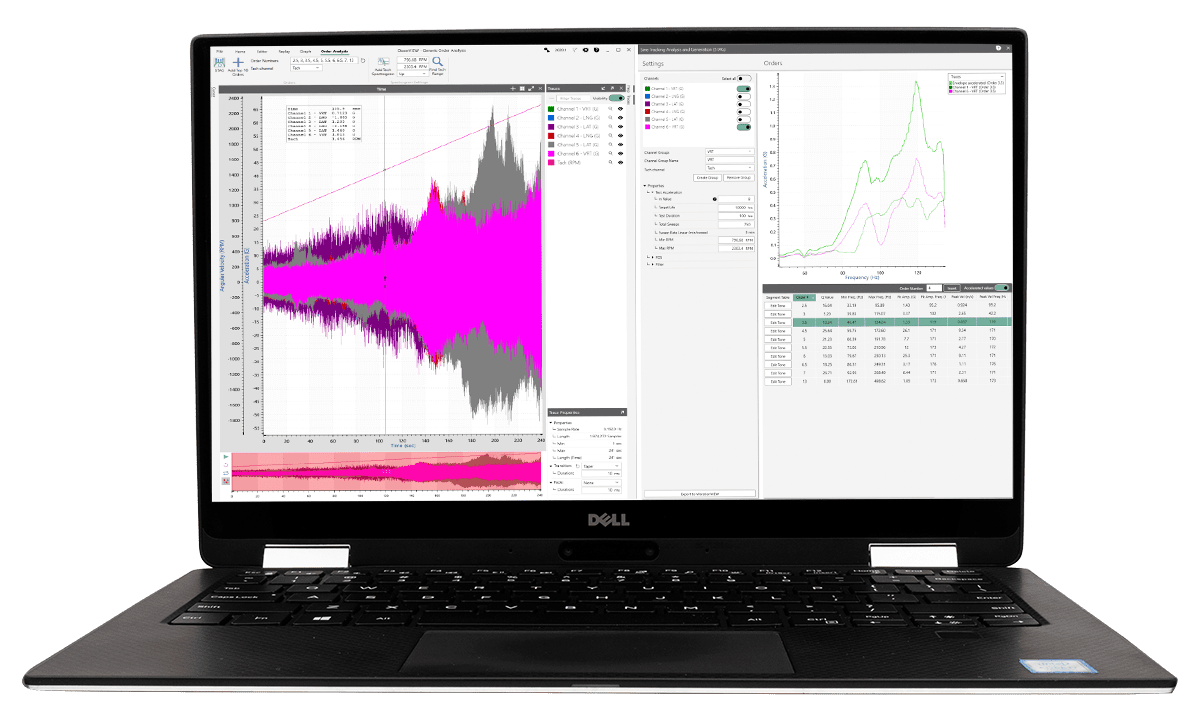
Vibration Research developed the Sine Tracking, Analysis and Generation (STAG) tool to create a Sine-on-Random test reflective of environments with rotational components, such as in engines. If the engineer selects the FDS for this environment type, the test profile may not accurately represent the dominant sine tones.
The STAG tool is an accurate and convenient method for developing an SoR test. Vibration Research developed the software to reduce the standard processing time and bypass manual entry for the highest level of accuracy.
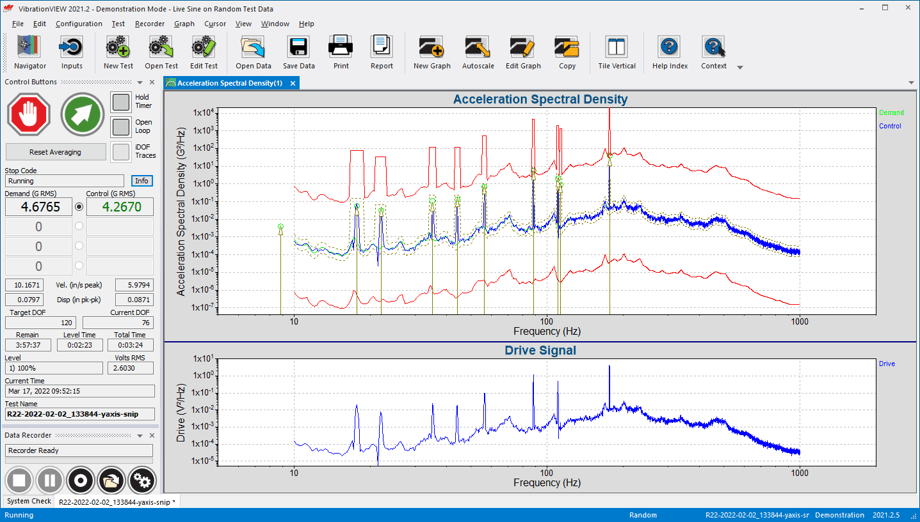
STAG-generated sine-on-random test profile.
Conclusion
Vibration test acceleration saves time and costs compared to testing under normal conditions. Being attentive to the characteristics of the vibration environment(s) will lend to a more accurate accelerated test.
For a more detailed description of accelerated vibration testing, read the paper How Do I Measure the Life of My Product? Download a free demo of the VibrationVIEW software and try out the FDS software today.